注意
前往結尾以下載完整範例程式碼。或透過 JupyterLite 或 Binder 在您的瀏覽器中執行此範例
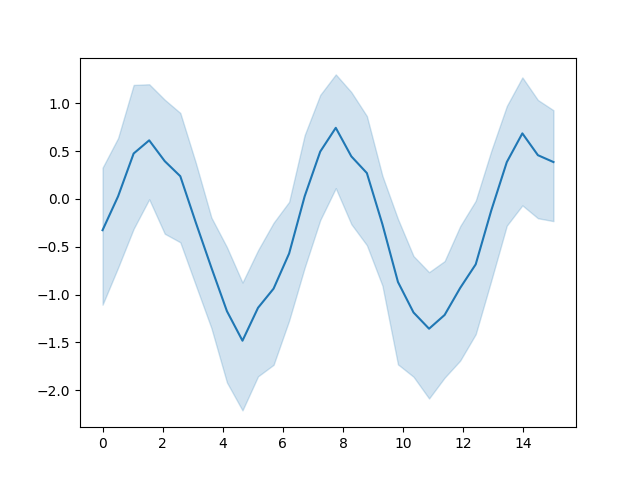
Seaborn 範例#
此範例示範 Seaborn 圖表。預設情況下,將會擷取由 Matplotlib **以及**任何基於 Matplotlib 的套件 (例如,Seaborn) 所產生的圖形。有關詳細資訊,請參閱圖像抓取器。
# Author: Michael Waskom & Lucy Liu
# License: BSD 3 clause

import matplotlib.pyplot as plt
import numpy as np
import seaborn as sns

# Enforce the use of default set style

# Create a noisy periodic dataset
y_array = np.array([])
x_array = np.array([])
rs = np.random.RandomState(8)
for _ in range(15):
    x = np.linspace(0, 30 / 2, 30)
    y = np.sin(x) + rs.normal(0, 1.5) + rs.normal(0, 0.3, 30)
    y_array = np.append(y_array, y)
    x_array = np.append(x_array, x)

# Plot the average over replicates with confidence interval
sns.lineplot(y=y_array, x=x_array)
# to avoid text output
plt.show()
腳本總執行時間: (0 分鐘 1.945 秒)
預估記憶體使用量: 242 MB