注意
前往結尾以下載完整的範例程式碼。或透過 JupyterLite 或 Binder 在您的瀏覽器中執行此範例
繪製符號 (向量或多邊形資料)#
使用資料集中的向量來繪製和定向符號/幾何物件。
import numpy as np

# sphinx_gallery_thumbnail_number = 4
import pyvista as pv
from pyvista import examples
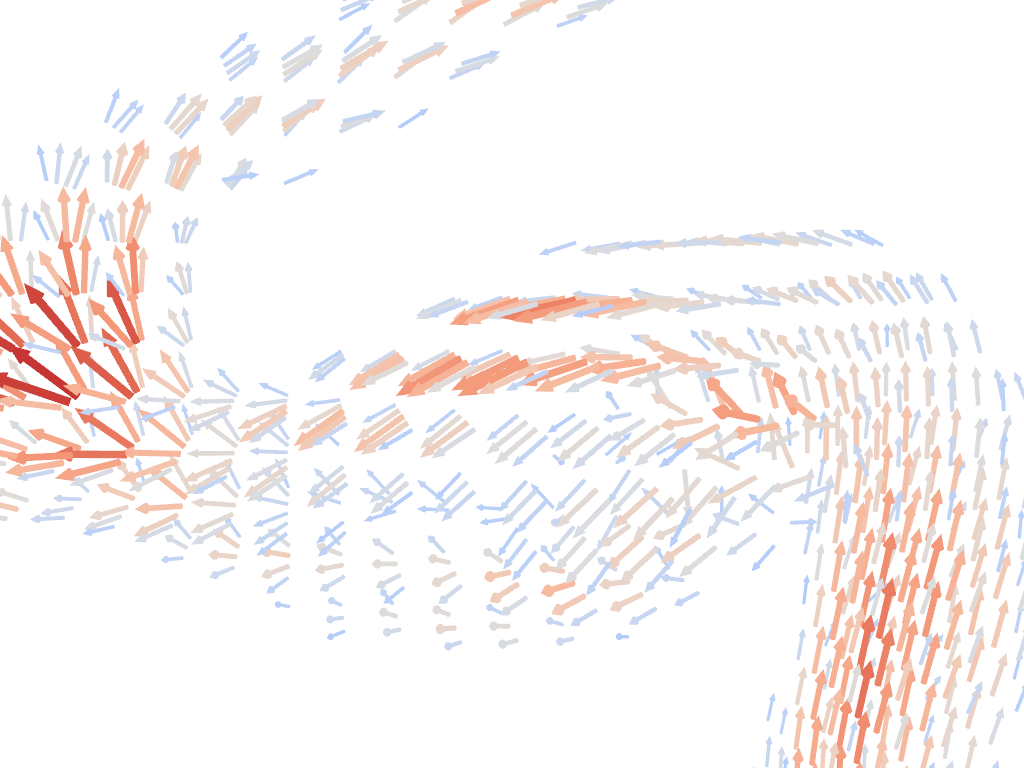
可以使用 pyvista.DataSetFilters.glyph() 過濾器來完成符號化
mesh = examples.download_carotid().threshold(145, scalars="scalars")
mask = mesh["scalars"] < 210
mesh["scalars"][mask] = 0  # null out smaller vectors

# Make a geometric object to use as the glyph
geom = pv.Arrow()  # This could be any dataset

# Perform the glyph
glyphs = mesh.glyph(orient="vectors", scale="scalars", factor=0.003, geom=geom)

# plot using the plotting class
pl = pv.Plotter()
pl.add_mesh(glyphs, show_scalar_bar=False, lighting=False, cmap="coolwarm")
pl.camera_position = [
    (146.53, 91.28, 21.70),
    (125.00, 94.45, 19.81),
    (-0.086, 0.007, 0.996),
]  # view only part of the vector field
cpos = pl.show(return_cpos=True)
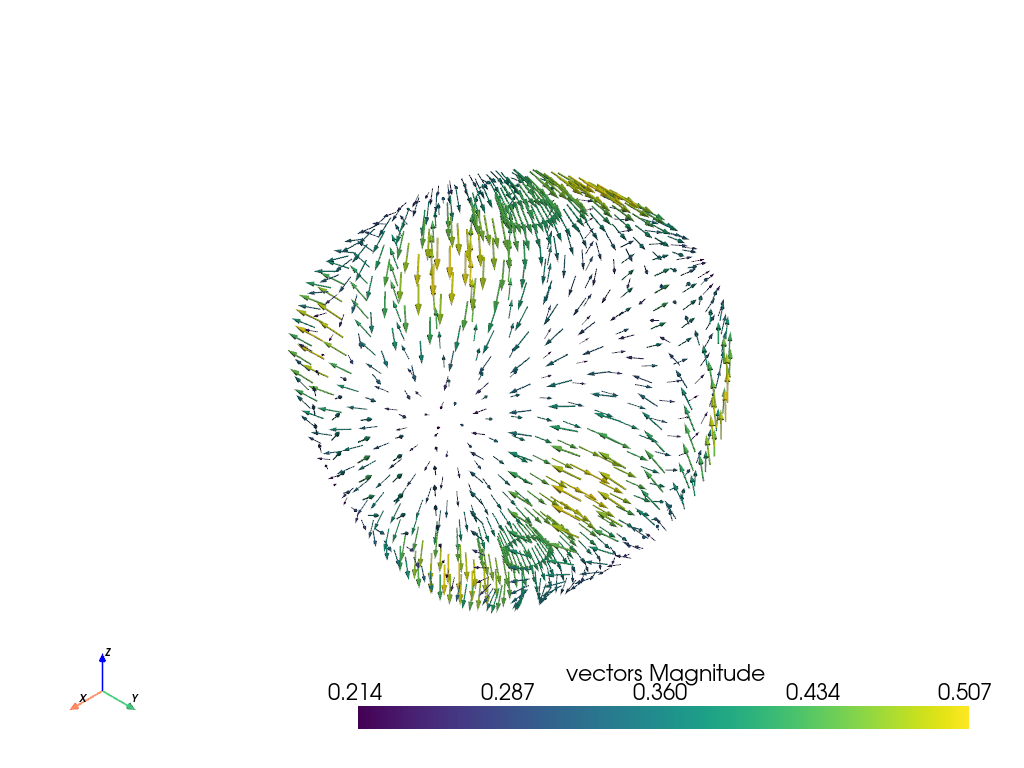
另一種方法是將向量直接載入到網格物件,然後存取 pyvista.DataSet.arrows 屬性。
sphere = pv.Sphere(radius=3.14)

# make cool swirly pattern
vectors = np.vstack(
    (
        np.sin(sphere.points[:, 0]),
        np.cos(sphere.points[:, 1]),
        np.cos(sphere.points[:, 2]),
    )
).T

# add and scale
sphere["vectors"] = vectors * 0.3
sphere.set_active_vectors("vectors")

# plot just the arrows
sphere.arrows.plot()
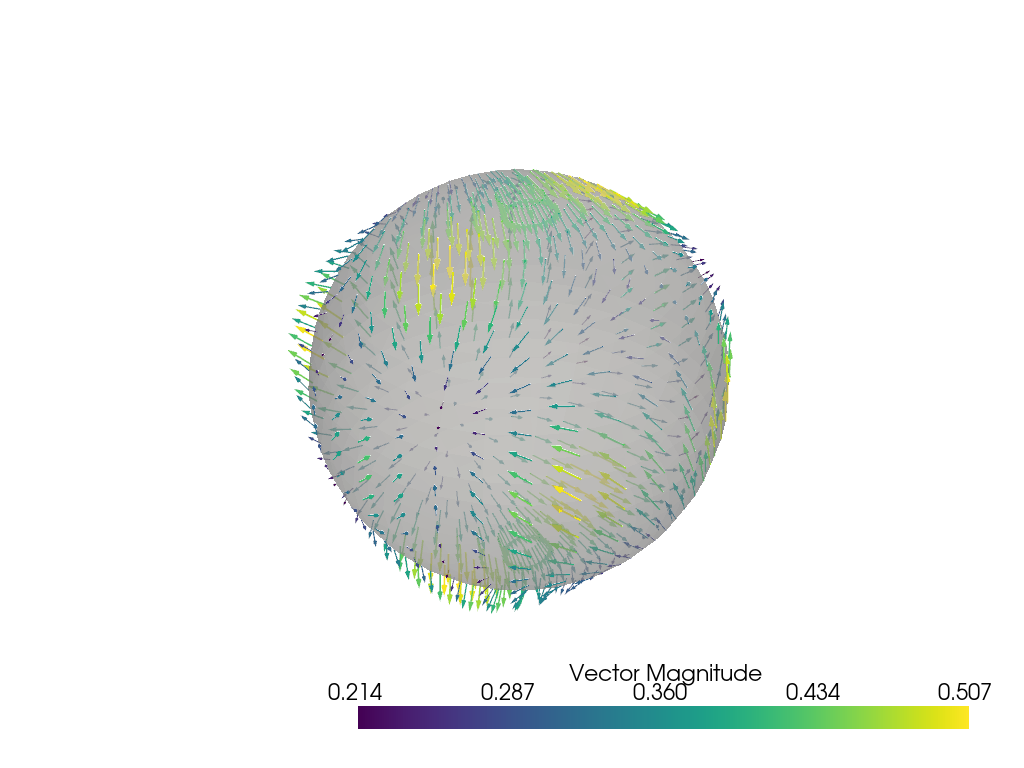
繪製箭頭和球體。
p = pv.Plotter()
p.add_mesh(sphere.arrows, lighting=False, scalar_bar_args={"title": "Vector Magnitude"})
p.add_mesh(sphere, color="grey", ambient=0.6, opacity=0.5, show_edges=False)
p.show()
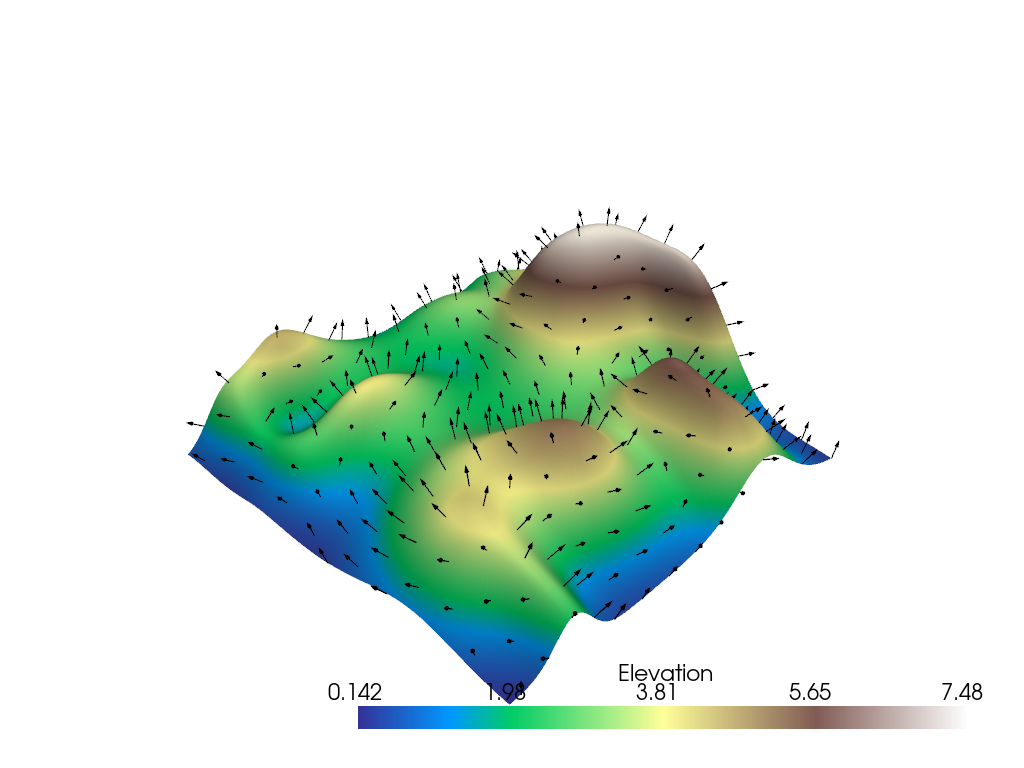
符號的子集#
有時您可能不希望輸入資料集中每個節點都有符號。在這種情況下,您可以選擇使用合併容差為輸入資料集的子集建立符號。在這裡,我們指定了 5% 的合併容差,這相當於邊界框長度的 5%。
# Example dataset with normals
mesh = examples.load_random_hills()

# create a subset of arrows using the glyph filter
arrows = mesh.glyph(scale="Normals", orient="Normals", tolerance=0.05)

p = pv.Plotter()
p.add_mesh(arrows, color="black")
p.add_mesh(mesh, scalars="Elevation", cmap="terrain", smooth_shading=True)
p.show()
腳本總執行時間:(0 分鐘 5.249 秒)
預估記憶體使用量: 524 MB