注意
前往結尾以下載完整的範例程式碼。或者透過 JupyterLite 或 Binder 在您的瀏覽器中執行此範例
選擇縮圖圖形#
此範例示範如何選擇顯示為縮圖的圖形,如果範例產生多個圖形。這是透過指定關鍵字值對 sphinx_gallery_thumbnail_number = <圖形 編號> 作為範例檔案中 docstring 下方的某處註解來完成的。在此範例中,我們指定希望第二個圖形作為縮圖。
# Code source: Óscar Nájera
# License: BSD 3 clause
import matplotlib.pyplot as plt
import numpy as np
def main():
"""Plot expoential functions."""
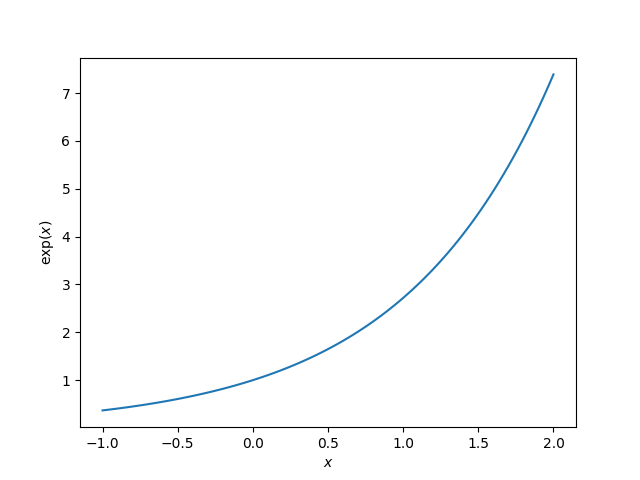
x = np.linspace(-1, 2, 100)
y = np.exp(x)
plt.figure()
plt.plot(x, y)
plt.xlabel("$x$")
plt.ylabel(r"$\exp(x)$")
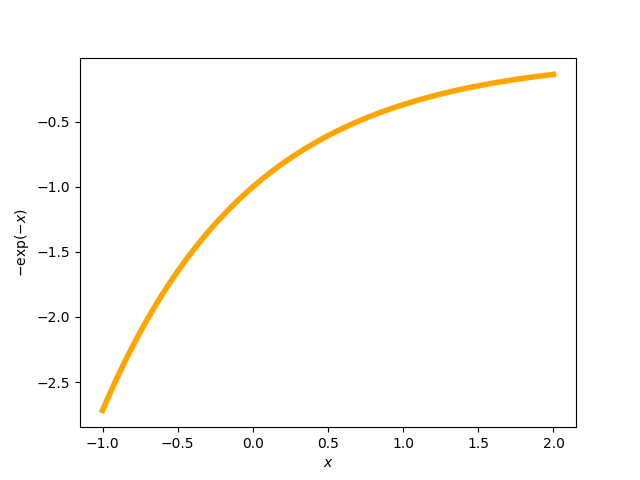
# The next line sets the thumbnail for the second figure in the gallery
# (plot with negative exponential in orange)
# sphinx_gallery_thumbnail_number = 2
plt.figure()
plt.plot(x, -np.exp(-x), color="orange", linewidth=4)
plt.xlabel("$x$")
plt.ylabel(r"$-\exp(-x)$")
# To avoid matplotlib text output
plt.show()
if __name__ == "__main__":
main()
腳本總執行時間: (0 分鐘 0.880 秒)
預估記憶體使用量: 176 MB