注意
前往結尾以下載完整的範例程式碼。或透過 JupyterLite 或 Binder 在您的瀏覽器中執行此範例
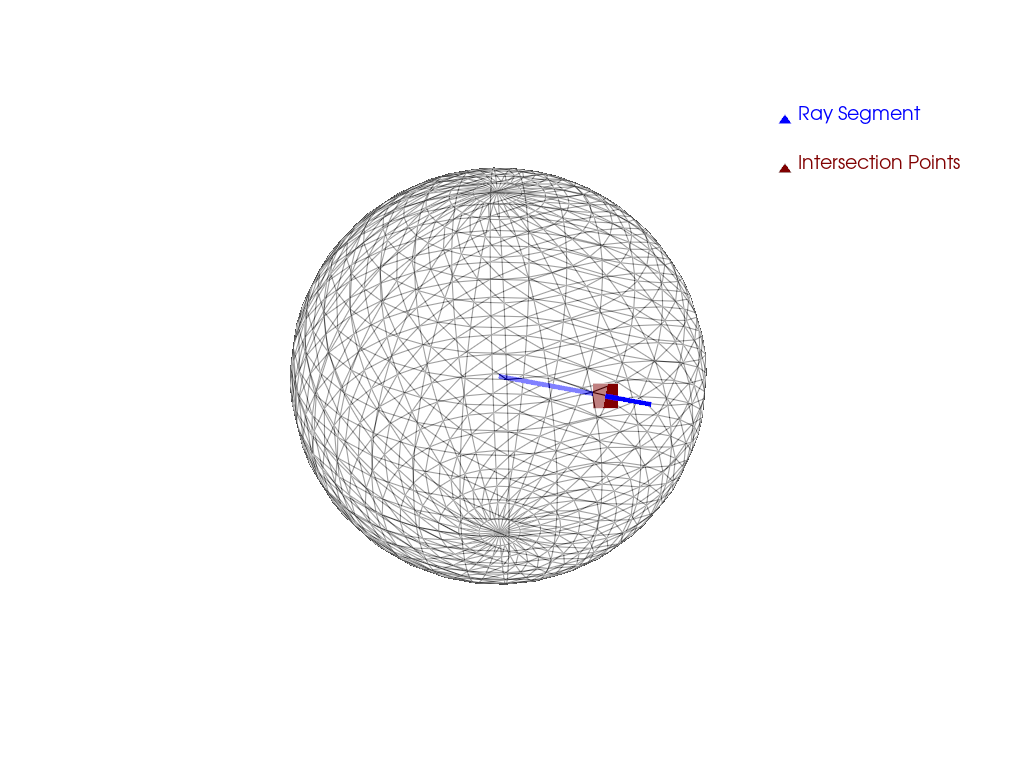
光線追蹤#
PolyData 物件的單線段光線追蹤。
import pyvista as pv

# Create source to ray trace
sphere = pv.Sphere(radius=0.85)

# Define line segment
start = [0, 0, 0]
stop = [0.25, 1, 0.5]

# Perform ray trace
points, ind = sphere.ray_trace(start, stop)

# Create geometry to represent ray trace
ray = pv.Line(start, stop)
intersection = pv.PolyData(points)

# Render the result
p = pv.Plotter()
p.add_mesh(
    sphere, show_edges=True, opacity=0.5, color="w", lighting=False, label="Test Mesh"
)
p.add_mesh(ray, color="blue", line_width=5, label="Ray Segment")
p.add_mesh(intersection, color="maroon", point_size=25, label="Intersection Points")
p.add_legend()
p.show()
腳本的總執行時間: (0 分鐘 0.674 秒)
預估記憶體使用量: 188 MB