注意
跳至結尾以下載完整的範例程式碼。或透過 JupyterLite 或 Binder 在您的瀏覽器中執行此範例
為縮圖影像提供圖片#
此範例示範如何提供一個顯示為縮圖的圖片。這是透過在範例檔案的 docstring 下方的某處,以註解方式指定關鍵字-值配對 sphinx_gallery_thumbnail_path = 'fig path' 來完成的。在此範例中,我們指定希望使用資料夾 _static 中的圖片 demo.png 作為縮圖。
import matplotlib.pyplot as plt
import numpy as np

# sphinx_gallery_thumbnail_path = '_static/demo.png'
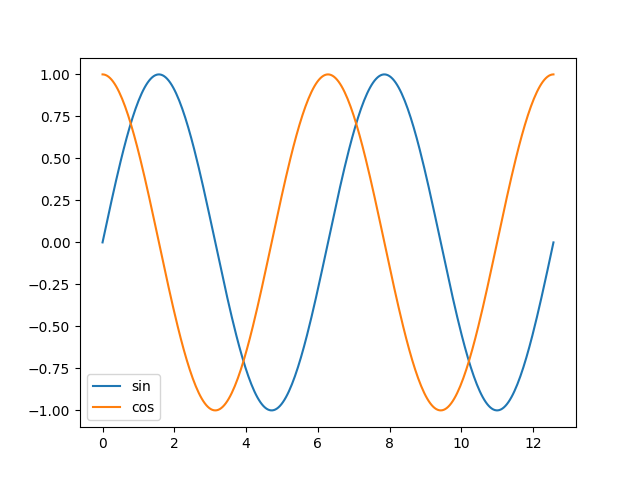
繪圖 1#
plt.figure()
plt.plot(x, y1, label="sin")
plt.plot(x, y2, label="cos")
plt.legend()
plt.show()
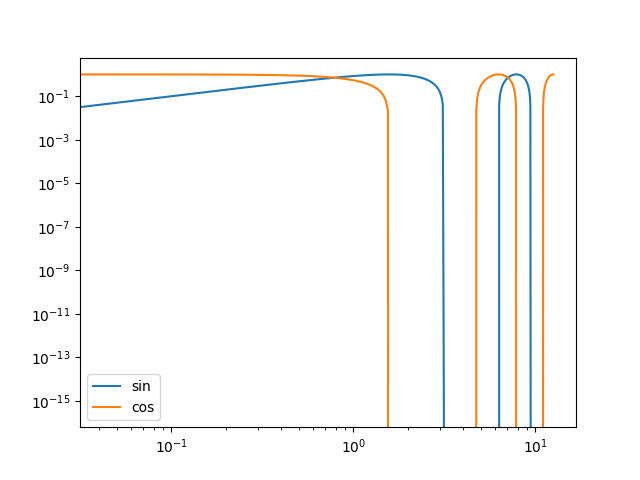
繪圖 2#
plt.figure()
plt.plot(x, y1, label="sin")
plt.plot(x, y2, label="cos")
plt.legend()
plt.xscale("log")
plt.yscale("log")
plt.show()
腳本總執行時間: (0 分鐘 1.683 秒)
預估記憶體用量: 176 MB